Strategy Tester Report
SMC Trader 2 MAs 5 20 EMA1
AlpariUK-Demo (Build 225)
| Symbol | EURUSD (Euro vs US Dollar) | ||||
| Period | 1 Hour (H1) 2010.03.01 00:00 - 2010.03.26 21:00 (2010.03.01 - 2010.03.27) | ||||
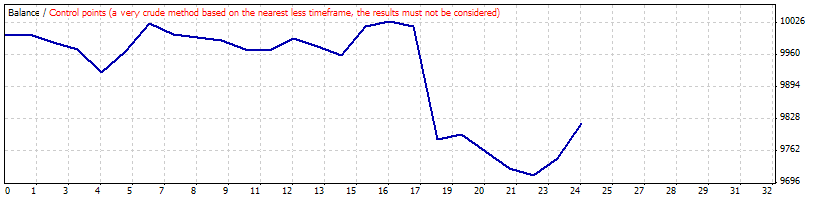
| Model | Control points (a very crude method, the results must not be considered) | ||||
| Parameters | TakeProfit=50; Lots=0.1; InitialStop=30; TrailingStop=20; | ||||
| Bars in test | 1474 | Ticks modelled | 12836 | Modelling quality | n/a |
| Mismatched charts errors | 9 | ||||
| Initial deposit | 10000.00 | ||||
| Total net profit | -180.96 | Gross profit | 316.74 | Gross loss | -497.70 |
| Profit factor | 0.64 | Expected payoff | -7.54 | ||
| Absolute drawdown | 297.21 | Maximal drawdown | 376.81 (3.74%) | Relative drawdown | 3.74% (376.81) |
| Total trades | 24 | Short positions (won %) | 12 (41.67%) | Long positions (won %) | 12 (33.33%) |
| Profit trades (% of total) | 9 (37.50%) | Loss trades (% of total) | 15 (62.50%) | ||
| Largest | profit trade | 72.50 | loss trade | -231.62 | |
| Average | profit trade | 35.19 | loss trade | -33.18 | |
| Maximum | consecutive wins (profit in money) | 2 (107.02) | consecutive losses (loss in money) | 5 (-56.28) | |
| Maximal | consecutive profit (count of wins) | 107.02 (2) | consecutive loss (count of losses) | -242.62 (2) | |
| Average | consecutive wins | 2 | consecutive losses | 3 | |
| # | Time | Type | Order | Size | Price | S / L | T / P | Profit | Balance |
| 1 | 2010.03.01 13:00 | sell | 1 | 0.10 | 1.35418 | 0.00000 | 0.00000 | ||
| 2 | 2010.03.01 19:00 | close | 1 | 0.10 | 1.35391 | 0.00000 | 0.00000 | 2.70 | 10002.70 |
| 3 | 2010.03.02 14:00 | buy | 2 | 0.10 | 1.35636 | 0.00000 | 0.00000 | ||
| 4 | 2010.03.02 16:00 | close | 2 | 0.10 | 1.35459 | 0.00000 | 0.00000 | -17.70 | 9985.00 |
| 5 | 2010.03.04 08:00 | sell | 3 | 0.10 | 1.36539 | 0.00000 | 0.00000 | ||
| 6 | 2010.03.04 10:00 | close | 3 | 0.10 | 1.36680 | 0.00000 | 0.00000 | -14.10 | 9970.90 |
| 7 | 2010.03.04 14:00 | buy | 4 | 0.10 | 1.36845 | 0.00000 | 0.00000 | ||
| 8 | 2010.03.04 16:00 | close | 4 | 0.10 | 1.36368 | 0.00000 | 0.00000 | -47.70 | 9923.20 |
| 9 | 2010.03.04 16:00 | sell | 5 | 0.10 | 1.36368 | 0.00000 | 0.00000 | ||
| 10 | 2010.03.04 22:00 | close | 5 | 0.10 | 1.35930 | 0.00000 | 0.00000 | 43.80 | 9967.00 |
| 11 | 2010.03.05 18:00 | buy | 6 | 0.10 | 1.36090 | 0.00000 | 0.00000 | ||
| 12 | 2010.03.08 10:00 | close | 6 | 0.10 | 1.36664 | 0.00000 | 0.00000 | 57.33 | 10024.33 |
| 13 | 2010.03.08 18:00 | sell | 7 | 0.10 | 1.36121 | 0.00000 | 0.00000 | ||
| 14 | 2010.03.09 05:00 | close | 7 | 0.10 | 1.36336 | 0.00000 | 0.00000 | -21.58 | 10002.75 |
| 15 | 2010.03.10 00:00 | buy | 8 | 0.10 | 1.36037 | 0.00000 | 0.00000 | ||
| 16 | 2010.03.10 02:00 | close | 8 | 0.10 | 1.35957 | 0.00000 | 0.00000 | -8.00 | 9994.75 |
| 17 | 2010.03.10 03:00 | sell | 9 | 0.10 | 1.35956 | 0.00000 | 0.00000 | ||
| 18 | 2010.03.10 05:00 | close | 9 | 0.10 | 1.36006 | 0.00000 | 0.00000 | -5.00 | 9989.75 |
| 19 | 2010.03.10 06:00 | buy | 10 | 0.10 | 1.36019 | 0.00000 | 0.00000 | ||
| 20 | 2010.03.10 08:00 | close | 10 | 0.10 | 1.35823 | 0.00000 | 0.00000 | -19.60 | 9970.15 |
| 21 | 2010.03.10 08:00 | sell | 11 | 0.10 | 1.35823 | 0.00000 | 0.00000 | ||
| 22 | 2010.03.10 11:00 | close | 11 | 0.10 | 1.35844 | 0.00000 | 0.00000 | -2.10 | 9968.05 |
| 23 | 2010.03.10 13:00 | buy | 12 | 0.10 | 1.36169 | 0.00000 | 0.00000 | ||
| 24 | 2010.03.11 01:00 | close | 12 | 0.10 | 1.36433 | 0.00000 | 0.00000 | 26.19 | 9994.24 |
| 25 | 2010.03.15 06:00 | sell | 13 | 0.10 | 1.37360 | 0.00000 | 0.00000 | ||
| 26 | 2010.03.15 08:00 | close | 13 | 0.10 | 1.37540 | 0.00000 | 0.00000 | -18.00 | 9976.24 |
| 27 | 2010.03.15 08:00 | buy | 14 | 0.10 | 1.37540 | 0.00000 | 0.00000 | ||
| 28 | 2010.03.15 09:00 | close | 14 | 0.10 | 1.37368 | 0.00000 | 0.00000 | -17.20 | 9959.04 |
| 29 | 2010.03.15 09:00 | sell | 15 | 0.10 | 1.37368 | 0.00000 | 0.00000 | ||
| 30 | 2010.03.15 22:00 | close | 15 | 0.10 | 1.36779 | 0.00000 | 0.00000 | 58.90 | 10017.94 |
| 31 | 2010.03.16 13:00 | buy | 16 | 0.10 | 1.37160 | 0.00000 | 0.00000 | ||
| 32 | 2010.03.16 19:00 | close | 16 | 0.10 | 1.37270 | 0.00000 | 0.00000 | 11.00 | 10028.94 |
| 33 | 2010.03.17 15:00 | sell | 17 | 0.10 | 1.37533 | 0.00000 | 0.00000 | ||
| 34 | 2010.03.17 18:00 | close | 17 | 0.10 | 1.37643 | 0.00000 | 0.00000 | -11.00 | 10017.94 |
| 35 | 2010.03.17 19:00 | buy | 18 | 0.10 | 1.37777 | 0.00000 | 0.00000 | ||
| 36 | 2010.03.23 02:00 | close | 18 | 0.10 | 1.35465 | 0.00000 | 0.00000 | -231.62 | 9786.32 |
| 37 | 2010.03.23 08:00 | sell | 19 | 0.10 | 1.35192 | 0.00000 | 0.00000 | ||
| 38 | 2010.03.23 14:00 | close | 19 | 0.10 | 1.35094 | 0.00000 | 0.00000 | 9.80 | 9796.12 |
| 39 | 2010.03.25 13:00 | buy | 20 | 0.10 | 1.33611 | 0.00000 | 0.00000 | ||
| 40 | 2010.03.25 15:00 | close | 20 | 0.10 | 1.33250 | 0.00000 | 0.00000 | -36.10 | 9760.02 |
| 41 | 2010.03.25 15:00 | sell | 21 | 0.10 | 1.33250 | 0.00000 | 0.00000 | ||
| 42 | 2010.03.25 16:00 | close | 21 | 0.10 | 1.33580 | 0.00000 | 0.00000 | -33.00 | 9727.02 |
| 43 | 2010.03.25 16:00 | buy | 22 | 0.10 | 1.33580 | 0.00000 | 0.00000 | ||
| 44 | 2010.03.25 17:00 | close | 22 | 0.10 | 1.33430 | 0.00000 | 0.00000 | -15.00 | 9712.02 |
| 45 | 2010.03.25 18:00 | sell | 23 | 0.10 | 1.33421 | 0.00000 | 0.00000 | ||
| 46 | 2010.03.26 01:00 | close | 23 | 0.10 | 1.33075 | 0.00000 | 0.00000 | 34.52 | 9746.54 |
| 47 | 2010.03.26 05:00 | buy | 24 | 0.10 | 1.33361 | 0.00000 | 0.00000 | ||
| 48 | 2010.03.26 21:59 | close at stop | 24 | 0.10 | 1.34086 | 0.00000 | 0.00000 | 72.50 | 9819.04 |